


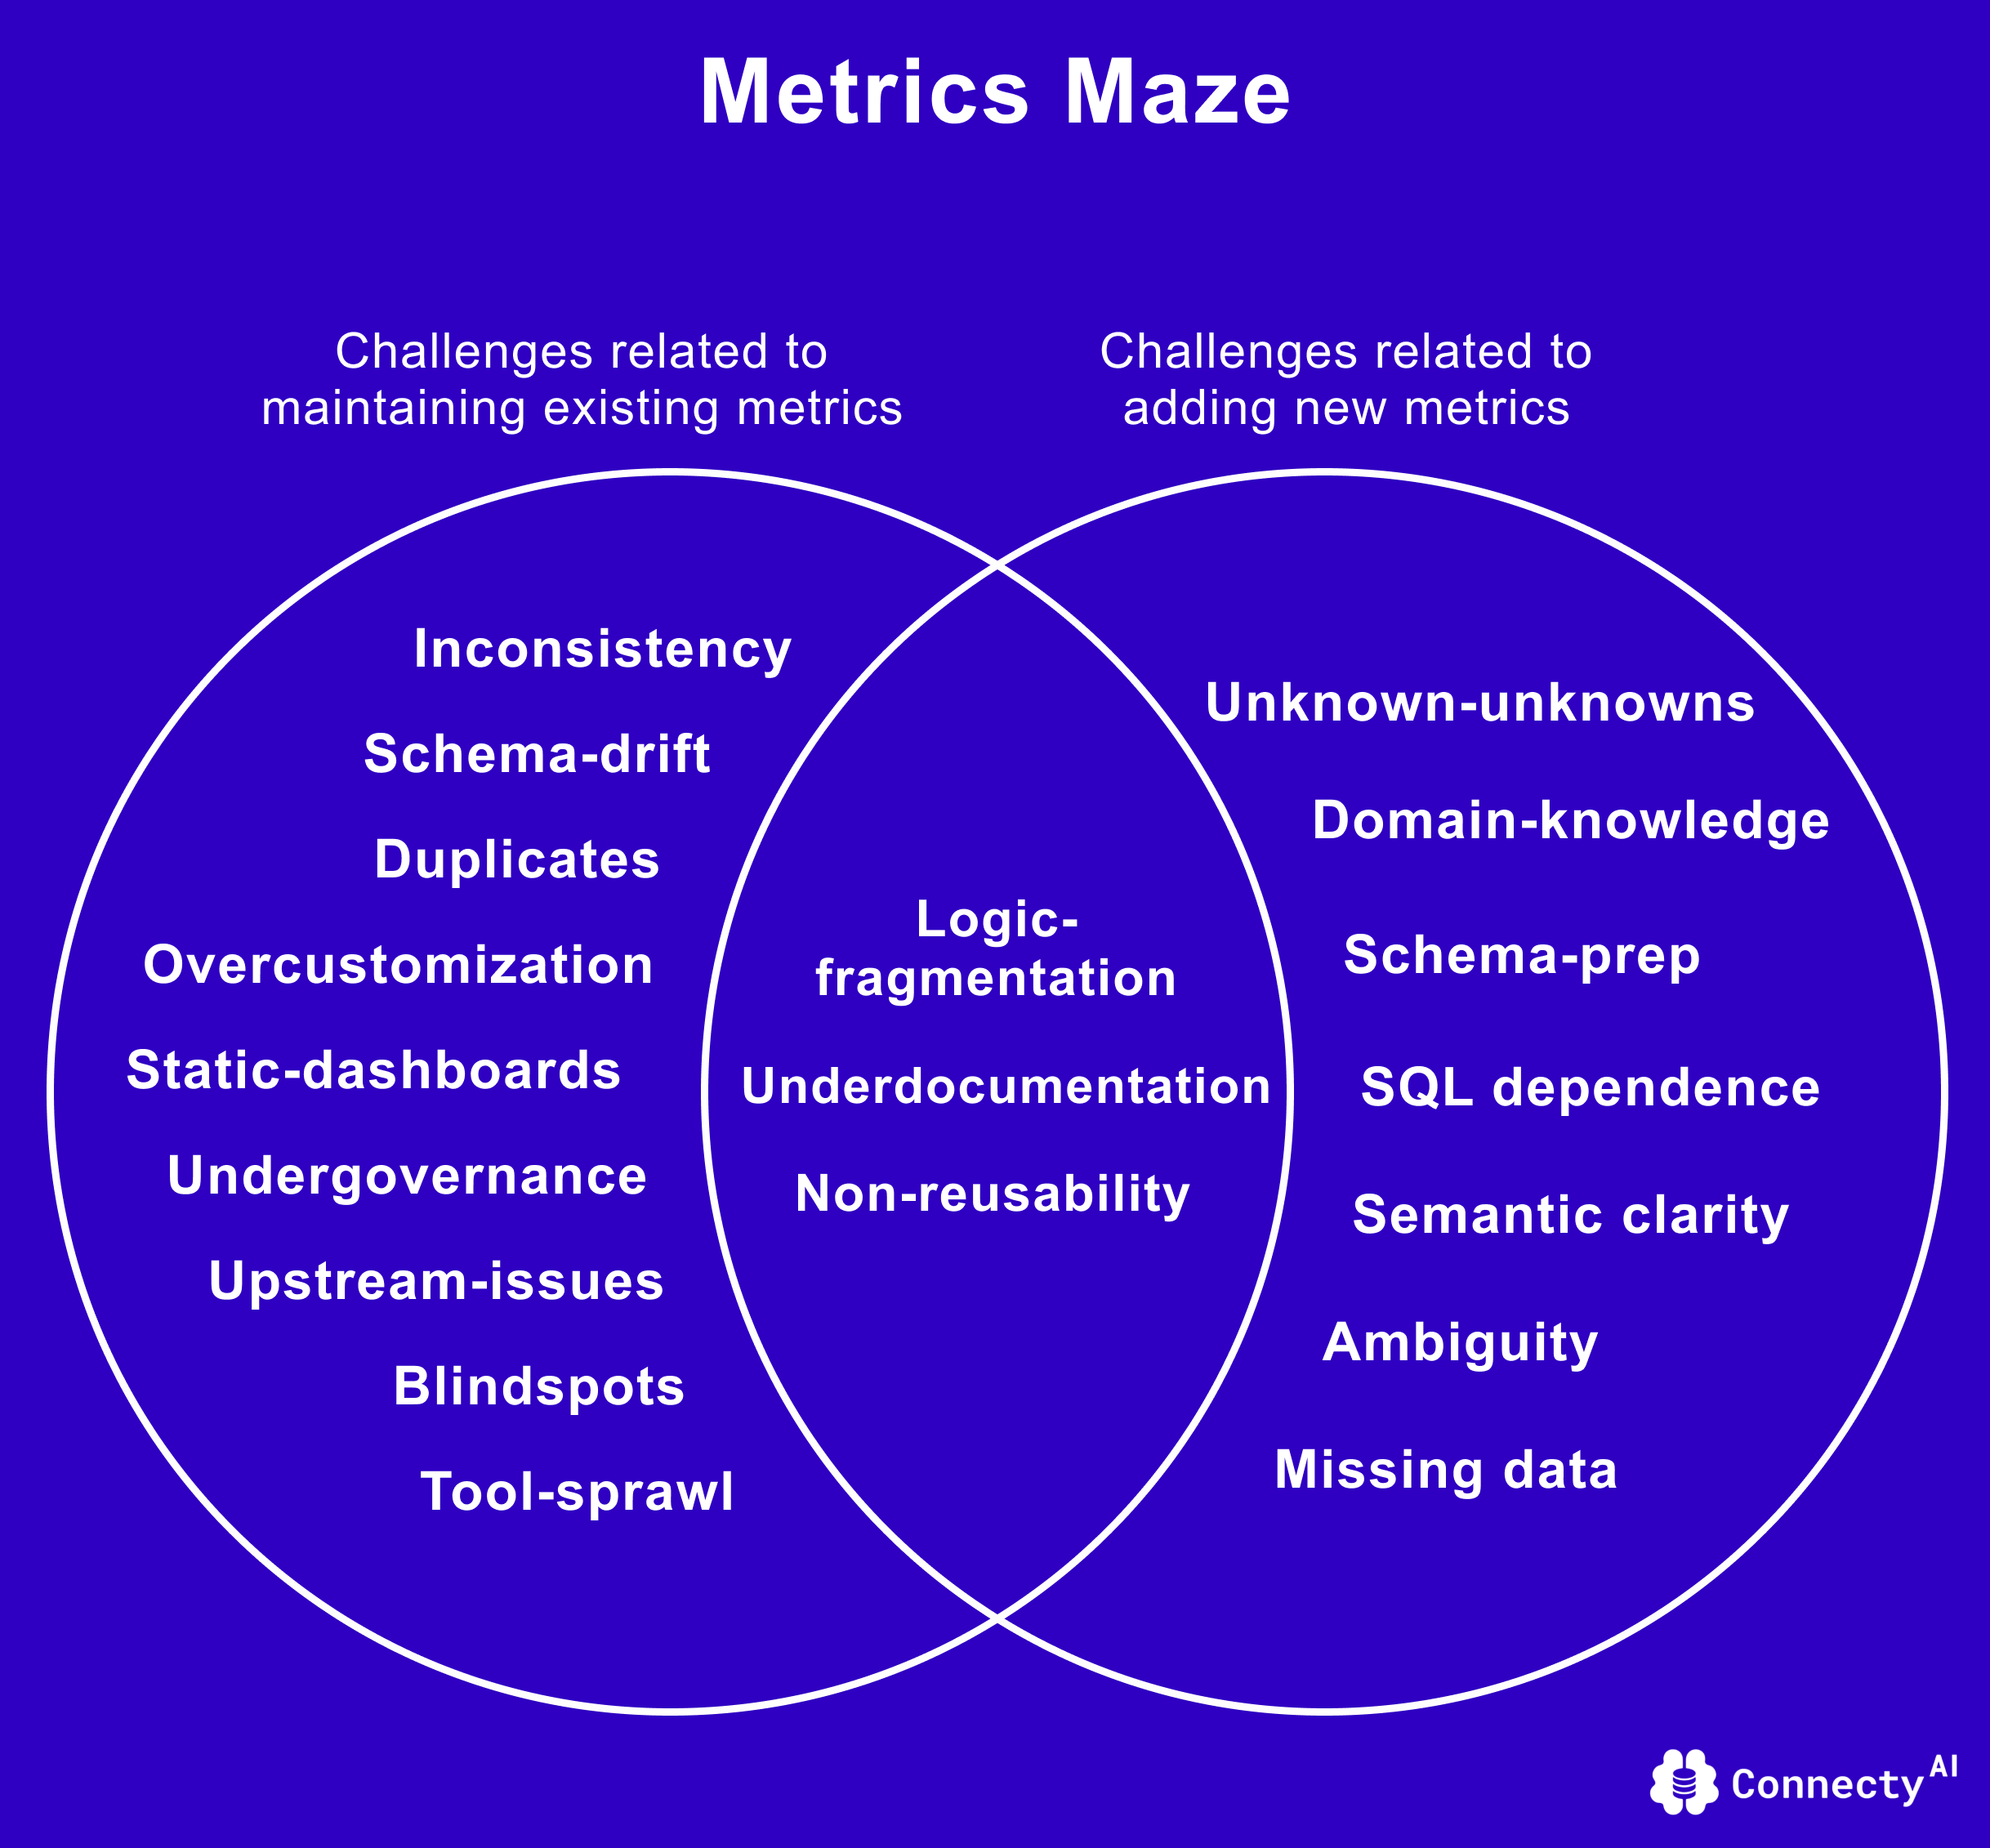
What’s broken today?
As a data leader at a growing company, you’re responsible for ensuring your organization uses the right metrics to drive decisions - and can act on them quickly and confidently. But metric definitions are often scattered, inconsistent, and duplicated across teams and tools, often with conflicting or outdated docs documentation.
This doesn’t just increase data workload - it leads to misinformed decisions that can cost millions and creates a general lack of trust in dashboards. The deeper problem isn’t just broken metrics - it’s the broken way they’re built.
Business logic lives in dashboards, notebooks, and scattered SQL files. It’s hard to track, easy to duplicate, and nearly impossible to manage as the business grows.
No time for manual semantic layers in the AI era.
Semantic layers were supposed to fix this - becoming a single source of truth. But who has time for months of setup, rigid modeling, enforcement, and constant maintenance?
That’s why most teams skip them entirely - or give up halfway through. As a result, metrics are defined ad hoc across tools, with no shared logic or governance.
What if the semantic layer could build itself - within minutes - and stay up-to-date in real time?
What if it could learn from how metrics are used, flag inconsistencies no human could catch, and suggest smarter, reusable logic that spans teams, tools, and time - all while keeping you fully in control?
What if you have an intelligent solution that didn’t just store logic - what if it truly understood it?
- What if it helped you define metrics clearly, once - and reuse them everywhere?
- What if it recommended the right metric for each business context - so teams never have to guess or settle for what’s ‘popular’?
- What if it reused and adapted the granular building blocks of your metrics across tools and dashboards?
- What if it surfaced conflicts the moment definitions clashed - before confusion spread?
- What if every metric was interpreted the same way - automatically, consistently, and without adding complexity to your workflow?
That’s exactly what Connecty AI offers - in real-time.
How Connecty AI Learns Your Business Logic to Generate Insights?
Instead of just learning how to write queries, Connecty learns how your business actually works - your rules, your logic, and how you define success - i.e. down to the granular components of each metric and their relationships. This knowledge is stored in a real-time updated autonomous semantic graph (we call it the Context Graph) that can be accessed via an intuitive visual interactive graph.
What Connecty AI does:
- Plug-and-play any data source (e.g. Snowflake, Databricks, BigQuery, PostgreSQL)
- Maps your metric logic and data catalog within minutes through an autonomous semantic graph
- Automatically recommends the right metric based on business context, or infers a new one if not already defined
- Powers complex analysis in natural language by identifying or inferring the right metric through semantic intelligence
- Detects and resolves conflicts using intelligent versioning
- Reuses and adapts granular metric components across Connecty AI platform
- Keeps everything consistent, explainable, and easy to manage
So your definitions aren't lost - they compound. Analyses can be built upon and extended by others, with a simple natural language question using Connecty's Chat.
And because it’s powered by deep reasoning, Connecty can automatically adjust when your business requirements change - whether you're evolving your data sources or expanding dashboard with new filters and dimensions.
That means metrics aren’t just static - they’re living, evolving entities, always aligned with your business context.
Why Connecty AI Is Unlike Anything You’ve Seen
No more conflicting metrics. No more AI mistakes.
Just one shared, evolving source of truth - fast to set up, easy to trust, and ready to grow with you. Welcome to a future where metrics aren’t static - they’re alive.
Schedule a demo to see Agentic AI for Data in action.
